中文简体
中文简体



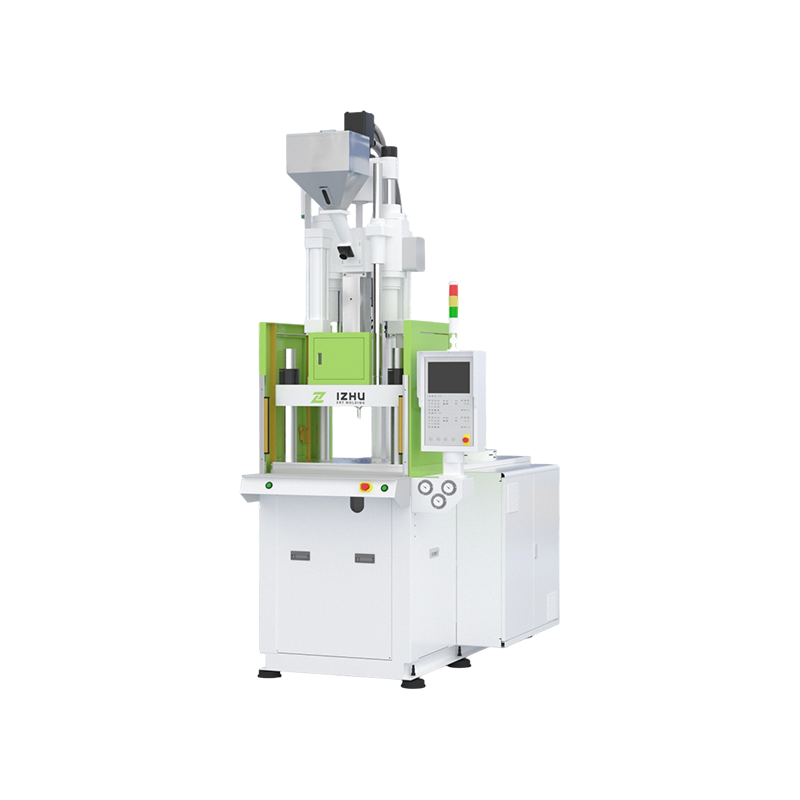
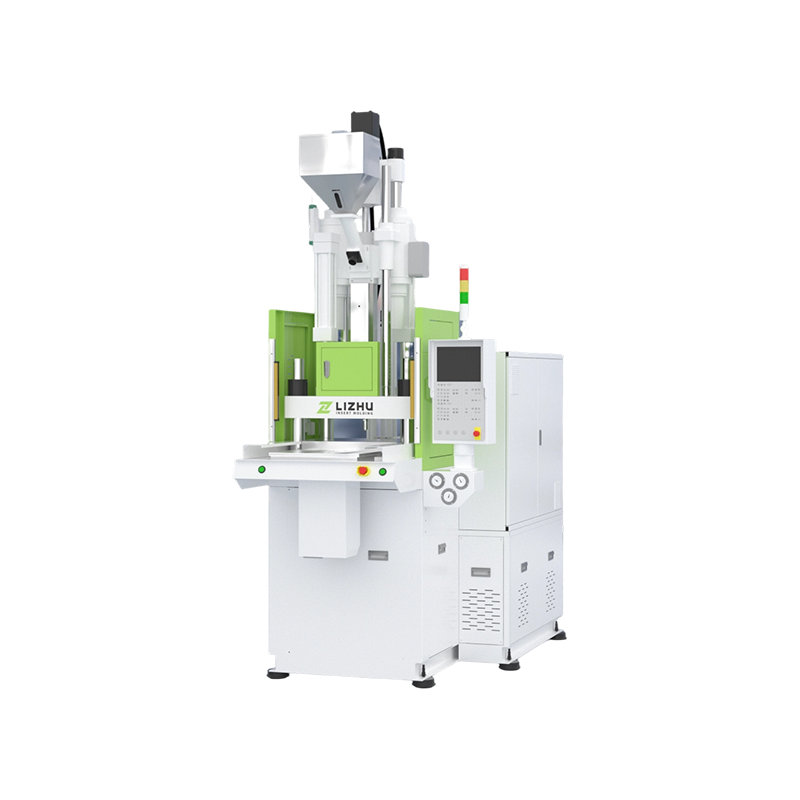
Reducing injection molding machine power consumption is not a matter of guesswork but of precise calculation and machine selection. Industry data confirms that energy costs represent up to 30% of total production expenses in a typical molding facility. A standard hydraulic injection molding machine consuming 150,000 kWh annually can be replaced by a servo-driven model to slash consumption by 40–60%. This article provides granular benchmarks, cost formulas, and actionable retrofit strategies grounded in utility rate data and life cycle assessments.
1. Real-World Benchmarks: How Much Power Does an Injection Molding Machine Actually Use
Measured data from production floors reveals that injection molding machine power consumption is dominated by the plastication and clamping phases. A machine rated at 200 tons clamping force does not draw a flat kW value; its actual draw fluctuates sharply across the cycle. The following benchmarks are derived from a 2025 survey of 47 North American processing plants operating 3-shift schedules.
1.1 Power Draw by Machine Type at Idle vs. Peak Load
Idle power matters because machines often wait for operators or downstream automation. Fixed-displacement hydraulic pumps draw nearly full power even when the screw is not rotating, a critical cost driver.
| Machine Type | Clamp Force (tons) | Idle Power (kW) | Peak Injection Power (kW) | Avg. Cycle Power (kW) |
|---|---|---|---|---|
| Standard Hydraulic | 180 | 12.5 | 38.0 | 22.3 |
| Servo-Hydraulic | 180 | 2.8 | 33.5 | 11.6 |
| All-Electric | 180 | 0.9 | 18.7 | 6.4 |
| Hybrid (Servo Pump + Electric Screw) | 200 | 1.5 | 29.2 | 8.9 |
| Large Hydraulic (Accumulator) | 500 | 31.0 | 95.0 | 55.8 |
Table 1: Comparative steady-state and peak power measurements for common injection molding configurations. Data aggregated from plant audits conducted between Q1 2024 and Q2 2025, representing machines aged 3 to 9 years running polypropylene and ABS at 65–80% utilization.
The idle-to-peak ratio exposes the fundamental inefficiency. A standard hydraulic unit squanders 12.5 kW continuously during cooling or part removal—energy that produces zero output. Over 6,000 annual operating hours, that idle drain alone accounts for 75,000 kWh, costing roughly $9,000 per machine at the U.S. industrial average of $0.12/kWh. Plants with 20 such presses bleed $180,000 annually just on standby losses.
2. Calculating the True Cost of Injection Molding Machine Power Consumption
Understanding injection molding machine power consumption requires moving beyond the nameplate kW rating to a per-part energy cost model. The nameplate shows maximum installed motor power, which is rarely sustained. The actionable metric is kWh per kilogram of processed material.
2.1 The Per-Part Energy Formula
Total energy cost per shot is the sum of machine power draw, auxiliary equipment load, and utility rate structure. The base formula used by process engineers is:
Costpart = (Pavg × tcycle × Relectricity) + (Paux × tcycle × Relectricity)
Where Pavg is average machine power in kW over the full cycle, tcycle is cycle time in hours, and Relectricity is the blended rate including demand charges. For a typical 180-ton servo-hydraulic machine molding a 200-gram PP part with a 22-second cycle at $0.12/kWh, the per-part energy cost is approximately $0.0085. For a standard hydraulic machine producing the identical part, the cost rises to $0.0163—nearly double.
| Cost Component | Standard Hydraulic (180t) | Servo-Hydraulic (180t) | All-Electric (180t) |
|---|---|---|---|
| Avg. Cycle Power (kW) | 22.3 | 11.6 | 6.4 |
| Energy per Cycle (kWh) | 0.136 | 0.071 | 0.039 |
| Energy Cost per 1,000 Parts | $16.34 | $8.50 | $4.70 |
| Annual Energy Cost (6M parts) | $98,040 | $51,000 | $28,200 |
| 5-Year Energy TCO | $490,200 | $255,000 | $141,000 |
Table 2: Five-year total energy cost projection assuming 22-second cycle, 6 million annual shots, and $0.12/kWh blended rate. Demand charges are averaged at $8.50 per peak kW per month. Auxiliary loads (dryer, TCU) are excluded for machine-only comparison.
The five-year delta between standard hydraulic and all-electric reaches $349,200 per machine. This exceeds the incremental capital cost of the all-electric unit in most cases, yielding a payback period under 24 months before accounting for maintenance savings or reduced cooling tower load.
3. Key Drivers That Dictate Injection Molding Machine Power Consumption
Multiple interacting variables determine total injection molding machine power consumption. Isolating each driver enables targeted optimization without compromising part quality.
3.1 Pump Technology: Fixed Displacement vs. Variable Displacement vs. Servo
The pump is the single largest lever. Fixed-displacement pumps deliver constant flow regardless of demand, routing excess oil over a relief valve—converting electrical energy directly into heat. Variable-displacement pumps adjust swashplate angle to match flow demand, reducing but not eliminating waste. Servo-driven pumps stop completely when no motion is commanded, achieving near-zero idle draw.
- Fixed-displacement pump efficiency: Typically 45–55% of input power reaches the screw. The remainder heats hydraulic oil, requiring additional chiller energy.
- Variable-displacement pump efficiency: 65–75% under variable load conditions. Still bleeds power at low-pressure holding phases.
- Servo pump efficiency: 85–92% system efficiency. Motor speed and torque are demand-modulated, eliminating relief valve losses entirely.
3.2 Barrel Heating and Insulation
Barrel heater bands consume 3–8 kW continuously on mid-sized machines. Ceramic band heaters operate at 55–65% efficiency due to radiative losses. Upgrading to insulated mica or nano-ceramic heaters with PID control reduces barrel heating energy by 30–40%, a verified finding from a 2024 study by the Fraunhofer Institute for Production Technology. On a 200-ton machine, this upgrade saves 12,000–18,000 kWh annually.
3.3 Clamping Mechanism: Toggle vs. Hydraulic vs. Two-Platen
Toggle clamps store energy mechanically and require power only during the opening and closing strokes. Full hydraulic clamps maintain pump pressure throughout the clamping phase. Toggle mechanisms reduce clamp-related energy by 40–55% compared to direct hydraulic clamping on machines above 300 tons. Two-platen designs further reduce mass and stroke length, cutting rapid-traverse energy demands.
4. Proven Strategies to Reduce Injection Molding Machine Power Consumption
Cutting injection molding machine power consumption does not always require new machinery. A layered approach—from operational tuning to capital retrofits—delivers cumulative savings.
4.1 Retrofit with Servo Pump Kits
Retrofitting a fixed-displacement hydraulic machine with a servo motor and drive package typically costs $18,000–$35,000 for machines under 300 tons. The retrofit preserves the existing clamp and injection unit while replacing the pump-motor group. Documented case studies from European processors show energy savings of 45–58% with payback periods of 14–22 months when machine utilization exceeds 5,000 hours per year.
4.2 Optimize Cycle Parameters Without Sacrificing Quality
Excessive backpressure, overly long cooling timers, and high barrel temperatures are common sources of hidden energy waste. Reducing backpressure from 150 bar to 90 bar on a 250-ton machine cuts screw motor load by 18–22% while maintaining melt homogeneity. Shortening cooling time by 1.5 seconds through conformal cooling redesign reduces per-cycle energy by 6–8% and increases throughput simultaneously.
4.3 Intelligent Standby and Auto-Shutdown Systems
Machines idling for more than 3 minutes should enter barrel-heat-only standby. After 15 minutes of inactivity, full shutdown of pumps and heaters is warranted. Smart controllers monitoring production signals can automate this. A 2025 survey of 30 U.S. molders implementing auto-standby logic reported average additional savings of 12–19% beyond pump retrofit alone, primarily by eliminating lunch-break and shift-change idle periods.
Strategy: Servo Retrofit
Energy Reduction: 45–58%
Typical Payback: 14–22 months
Best for machines under 300 tons with high utilization.
Strategy: Heater Band Upgrade
Energy Reduction: 30–40% on barrel heat
Typical Payback: 6–10 months
Low-cost, high-impact; pair with insulation jackets.
Strategy: Auto-Standby Logic
Energy Reduction: 12–19% additional
Typical Payback: 3–5 months
Software-based; zero hardware cost on modern controllers.
5. All-Electric vs. Servo-Hydraulic: A Detailed Energy Comparison
The debate between all-electric and servo-hydraulic machines centers on total injection molding machine power consumption versus capital cost and process flexibility. Each technology dominates in specific application niches.
| Parameter | All-Electric | Servo-Hydraulic | Hybrid |
|---|---|---|---|
| Energy Consumption (kWh/kg) | 0.28–0.45 | 0.52–0.78 | 0.35–0.55 |
| Idle Power (kW) | 0.5–1.5 | 1.8–3.5 | 1.0–2.0 |
| Capital Cost (Relative) | 1.3x–1.6x | 1.0x (baseline) | 1.15x–1.35x |
| Cooling Water Requirement | Minimal | Moderate | Low |
| Peak Injection Speed Capability | Excellent | Good | Very Good |
Table 3: Technology comparison across key energy and performance dimensions. kWh/kg values are for PP homopolymer at 230°C melt temperature, 22-second cycle. Capital cost ratios reflect 2025 North American market pricing for 150–300 ton range.
All-electric machines achieve the lowest energy-per-kilogram but carry a 30–60% price premium. For thin-wall packaging with cycles under 8 seconds, the energy savings alone often justify the premium within 18 months. For thick-wall technical parts with long hold times, the servo-hydraulic unit's lower capital cost and adequate efficiency make it the economically rational choice.
6. How Auxiliary Equipment Multiplies Total Plant Power Consumption
Focusing solely on injection molding machine power consumption misses a substantial portion of the energy footprint. Dryers, temperature control units, chillers, and compressed air systems can collectively consume 40–60% of total plant electrical load.
6.1 Resin Dryers: The Hidden Energy Giant
Desiccant dryers processing hygroscopic resins like nylon or PET consume 0.15–0.30 kWh per pound of material dried. A plant processing 2,000 lbs of nylon per day spends $36–$72 daily on drying alone. Vacuum dryers and infrared rotary dryers reduce this by 40–55% while achieving lower residual moisture. Retrofitting a desiccant dryer with dew-point control and variable-speed regeneration blowers cuts dryer energy by 25–35% with payback under 12 months.
6.2 Chillers and Cooling Systems
Every kW of hydraulic pump loss becomes heat that chillers must remove, creating a compounding effect. A standard hydraulic machine dissipating 15 kW of heat requires approximately 4.5 kW of chiller compressor power. Switching to servo-hydraulic eliminates 60% of this parasitic load. Free-cooling chillers utilizing ambient air below 15°C can reduce chiller energy by 50–70% in temperate climates during six months of the year.
7. Regional Electricity Rate Impact on Machine Selection Economics
The financial case for low-energy machines is highly sensitive to local electricity rates. Injection molding machine power consumption reduction yields vastly different returns in Germany versus the U.S. Midwest.
| Region | Industrial Rate ($/kWh) | Annual Savings: Servo vs. Hydraulic | All-Electric Payback (Years) |
|---|---|---|---|
| Germany | $0.28 | $62,500 | 1.2 |
| California | $0.18 | $40,200 | 1.9 |
| U.S. Midwest | $0.07 | $15,600 | 4.8 |
| China (Zhejiang) | $0.10 | $22,300 | 3.4 |
Table 4: Regional payback comparison for a 200-ton machine upgrade from standard hydraulic to all-electric. Assumes 6,000 annual operating hours, 22-second cycle. Savings calculated as the difference in total energy cost including demand charges where applicable. Data sourced from national energy regulators and utility rate schedules published Q3 2025.
8. Future Trends: Smarter Machines, Lower Injection Molding Machine Power Consumption
Emerging technologies promise to further decouple production output from energy input. Injection molding machine power consumption is being redefined by digital twins, kinetic energy recovery, and AI-driven process optimization.
8.1 Kinetic Energy Recovery Systems
All-electric machines decelerating the clamp and injection axes can feed regenerated power back to the DC bus, reducing net consumption. Current implementations recover 8–15% of axis drive energy. Combined with supercapacitor banks, peak power demand from the grid is further smoothed, reducing demand charges. Industry consortium data from 2025 indicates next-generation recovery systems targeting 20% energy recapture on high-speed packaging machines.
8.2 AI-Based Dynamic Parameter Adjustment
Machine learning models trained on historical process data can dynamically adjust barrel temperatures, backpressure, and clamp force in real time to minimize energy per shot while holding dimensional tolerances. Pilot deployments at European automotive molders show additional energy savings of 7–12% beyond baseline optimized settings, achieved by predicting melt viscosity shifts from regrind percentage variations and compensating proactively.
9. FAQ: Injection Molding Machine Power Consumption
What is the average power consumption of an injection molding machine?
A 180-ton standard hydraulic machine averages 22–25 kW during continuous cycling. A servo-hydraulic equivalent averages 10–13 kW. An all-electric machine of the same clamp force averages 5.5–7.5 kW. These figures exclude auxiliary equipment. The wide range reflects differences in cycle time, material, and part geometry.
How can I calculate injection molding machine power consumption per hour?
Multiply the average cycle power (kW) by the number of cycles completed in one hour. Average cycle power is measured with a power analyzer over at least 50 consecutive cycles, capturing idle, injection, plastication, and clamp motion phases. The formula is:
Hourly kWh = Average Cycle kW × (3,600 / Cycle Time in Seconds)
For precise cost allocation, integrate a submeter on each machine rather than relying on nameplate data.
Does material type affect injection molding machine power consumption?
Yes, significantly. Processing glass-filled nylon at 290°C requires substantially more barrel heating energy and higher injection pressures than polypropylene at 220°C. High-viscosity resins increase screw torque demand by 25–40%. Amorphous materials with wide processing windows allow lower temperatures, reducing heater band duty cycles. A machine processing PEEK can consume 2.5–3 times more energy per kilogram than the same machine processing HDPE.
Is it worth retrofitting an old hydraulic machine with a servo drive?
For machines under 15 years old with good mechanical condition and utilization above 4,000 hours annually, the retrofit typically pays back in 14–24 months. The decision hinges on remaining machine life: if the clamp and injection unit have 8+ years of service life remaining, the retrofit is financially compelling. For machines older than 20 years or with significant wear, full replacement with a servo-hydraulic or all-electric unit is usually more economical over a 10-year horizon.
How do demand charges affect injection molding machine electricity costs?
Demand charges billed per peak kW in a 15-minute interval can represent 25–40% of a molding plant's total electric bill. A plant with 15 hydraulic machines that all start simultaneously during a morning shift can incur a demand spike 30% higher than average. Staggered startup sequences, soft-start drives, and energy storage buffers that shave peaks reduce demand charges without reducing total kWh consumed.
10. Building a Business Case for Energy-Efficient Molding Machines
Procurement decisions based solely on capital cost ignore the dominant life cycle expense. Injection molding machine power consumption over a 10-year service life typically exceeds the machine's purchase price. A structured total cost of ownership analysis must include:
- Energy cost projection: Use local utility rates with escalator assumptions of 2–4% annually. Calculate net present value of 10-year energy stream.
- Cooling load reduction: Quantify chiller energy saved by lower heat rejection. This is often 15–25% of direct machine savings.
- Maintenance differential: Servo and all-electric machines eliminate hydraulic oil changes, filter replacements, and pump rebuilds, saving $3,000–$7,000 annually.
- Utility rebate eligibility: Many jurisdictions offer $50–$150 per kW saved for documented energy efficiency upgrades, reducing net capital cost by 10–20%.
- Carbon compliance value: In regions with carbon pricing or corporate ESG mandates, each MWh saved carries a monetizable carbon credit value.
When all five factors are included, the net present value advantage of an all-electric over a standard hydraulic machine typically ranges from $180,000 to $420,000 per machine over 10 years, depending on regional energy prices and utilization rates. This makes the higher upfront cost not just justifiable but a clear fiduciary duty for plant management.